Quantifying sustainability – How to anchor a value-creation approach
Why CFO-grade metrics are essential to proving the business value of sustainability - and how companies can quantify ESG initiatives to drive returns.


Sustainability-related value creation is increasingly at the core of sustainability strategy. Our earlier blog, Quantifying sustainability – how to anchor value-creation approach, explained the reasons for this shift. With value creation taking center stage, teams now need to quantify the sustainability premium, or “greenium”, of each sustainability-related opportunity. How would actions translate into reduced costs, revenue growth, cash flow stability, brand strength, and, ultimately, enterprise value (EV)? And how should companies capture their upside?
This article explores what greenium is, including its visible and less visible components, and how companies can use it to prioritize and turn sustainability-related value creation into a structural financial advantage. Some compelling examples will illustrate the quantified benefits.
Greenium, or sustainability’s financial reward, manifests itself in two forms that are connected, but have distinct roles in corporate and investor decision-making.
The first is a revenue greenium. This reflects revenue attributable to sustainability initiatives, including customers willing to pay a price premium, sustainable products gaining market share, or access to regulated or reputation-sensitive markets. A corporate-finance-grade approach to quantifying each pathway is crucial for disciplined capital allocation and prioritization. It enables clearer performance tracking and strengthens the credibility of sustainability-linked growth assumptions. It also gives investors visibility into how sustainability-related initiatives directly affect valuations.
The second is a financing greenium, which reflects lenders’ and investors' willingness to accept lower interest rates or yields, or to pay higher valuation premiums, because they believe that sustainability actions reduce business risk and boost enterprise value. This is based on the expectation that sustainability will enhance cash flow resilience, driven by lower transition risk, better regulatory positioning, or reduced exposure to volatile inputs such as energy or carbon prices.
Crucially, a lower discount rate can trigger a virtuous cycle in which more sustainability-related investments meet return thresholds, reinforcing further investment. Over time, this can shift portfolio-level capital allocation toward more resilient and future-aligned assets.
In their early stages, revenue greeniums typically manifest as price premiums: sustainable products or services that command higher prices than conventional alternatives. However, price alone is rarely the endgame.
Higher prices for sustainable products may not last. Some surveys show that retail customers are willing to pay about 10% to 20% for sustainable offerings, depending on sector and region. Other reports suggest that this willingness does not always translate into actual purchasing behavior, particularly in inflationary environments. This highlights the gap between stated preference and actual demand, reinforcing the need for disciplined commercial strategies. As the case studies below show, the B2B market follows a similar pattern.
However, companies can leverage temporary price premiums to achieve structural gains in market share. Well-executed strategies treat the price premium as a bridge. Early adopters, typically in regulated, reputation-sensitive, or high-specification markets, absorb modest premiums, providing the volume needed to accelerate learning curves, secure supply contracts, and reduce production costs. This bridge allows companies to transition from early adopter pricing to scalable, cost-competitive offerings.
Reducing costs in the supply chain is another pathway to increasing the revenue greenium. Most companies still focus on quantifying sustainability-related cost reductions, such as energy-efficiency measures and operational decarbonization, in Scope 1 and 2. However, as a 2024 CDP report highlighted, Scope 3 also offers excellent business cases for cost reductions. However, just 15% of the companies reporting to CDP seized Scope 3 opportunities, collectively saving US$13.6 billion in costs.
CDP estimates that companies collectively leave US$165 billion in potential cost reductions on the table by not specifically focusing on quantifying Scope 3 business cases. It would take a US$94 billion investment to realize those benefits.
|
Revenue case studies - Holcim and JSW Steel Holcim, a global supplier of building materials, is a clear illustration of how this transition can work. With its ECOPact concrete and ECOPlanet cement product lines, the company offered materials with at least 30% lower CO₂ intensity than standard local alternatives. Initially, these products commanded a modest premium. This allowed Holcim to invest in scaling effects, procurement innovation, and ongoing recipe optimization, which have driven down unit costs, enabling both volume expansion and margin improvement. The result has been growth not just in sustainable product sales, but in group-level profitability and recurring earnings before interest and tax (EBIT) margins.
Holcim’s financial performance highlights the benefits of a tiered low-CO₂ portfolio, which accelerates adoption and improves economics. Higher average selling prices lift revenue per unit. As learning effects and supply-chain efficiencies kick in, margins expand rather than compress, even as price premiums narrow. Similar dynamics are visible in other sectors. In the steel sector, for example, regulatory mechanisms such as the European Union’s Carbon Border Adjustment Mechanism (CBAM) effectively penalize high-emissions imports. Steel producer JSW Steel recognized an opportunity and introduced its low-carbon GreenEdge product line, specifically targeting European markets. In this case, the greenium reflects a relative cost advantage once carbon pricing is factored in. It allows JSW Steel to monetize sustainability where it is most valued, while building pathways to reduce costs over time. The lesson here is strategic segmentation and customer education: target regulated and reputation-sensitive buyers first, while building cost reduction pathways to expand addressable demand. |
Across sectors, the lesson is consistent. Revenue greenium is real, but it is conditional. It depends on precise targeting, credible quantification, and a clear path from premium pricing to scaled growth. Companies should prioritize regulated and reputation-sensitive segments initially, while simultaneously building cost reduction pathways to expand addressable demand. This approach will also attract capital. For investors, the key issue is not price premiums but whether companies can sustain them long enough to build scale and protect margins as competition increases.
The financing greenium directly influences enterprise value (EV) by impacting the cost of capital. It is determined by the reduction in the weighted-average cost of capital (WACC) attributable to a company’s sustainability characteristics.
This WACC advantage consists of a lower cost of debt and a lower cost of equity component. This advantage reflects the extent to which sustainability reduces risks, including lower exposure to carbon pricing, greater resilience to regulatory change, more stable input costs, or stronger alignment with long-term demand trends. In short, it gives lenders and investors more confidence, which translates into a lower cost of capital
Even a small reduction in WACC can materially increase EV, especially for companies with long-lived assets such as utilities or energy infrastructure. The reason is that the discounted cash flow (DCF) models discount all future cash flows at the WACC. In practice, analysts forecast cash flows explicitly for 5 to 10 years and capture the value beyond that horizon in a terminal value (TV). The terminal value often accounts for 60% to 80% of the total EV.
Due to this long-term effect, relatively modest shifts in the WACC of 50 to 100 basis points (bps) can materially alter valuation outcomes. In practical terms, a project or acquisition that looks marginal at an 8% WACC may be clearly commercially viable at 7%. This sensitivity explains why investors focus intently on factors that influence perceived risk and long-term cash flow stability. Below is an example of a potential solar installation project—an asset that typically lasts 25 to 30 years—and how discount rates influence its terminal value and, therefore, its commercial viability.
Sensitivity of the terminal value of a solar project to changes in WACC
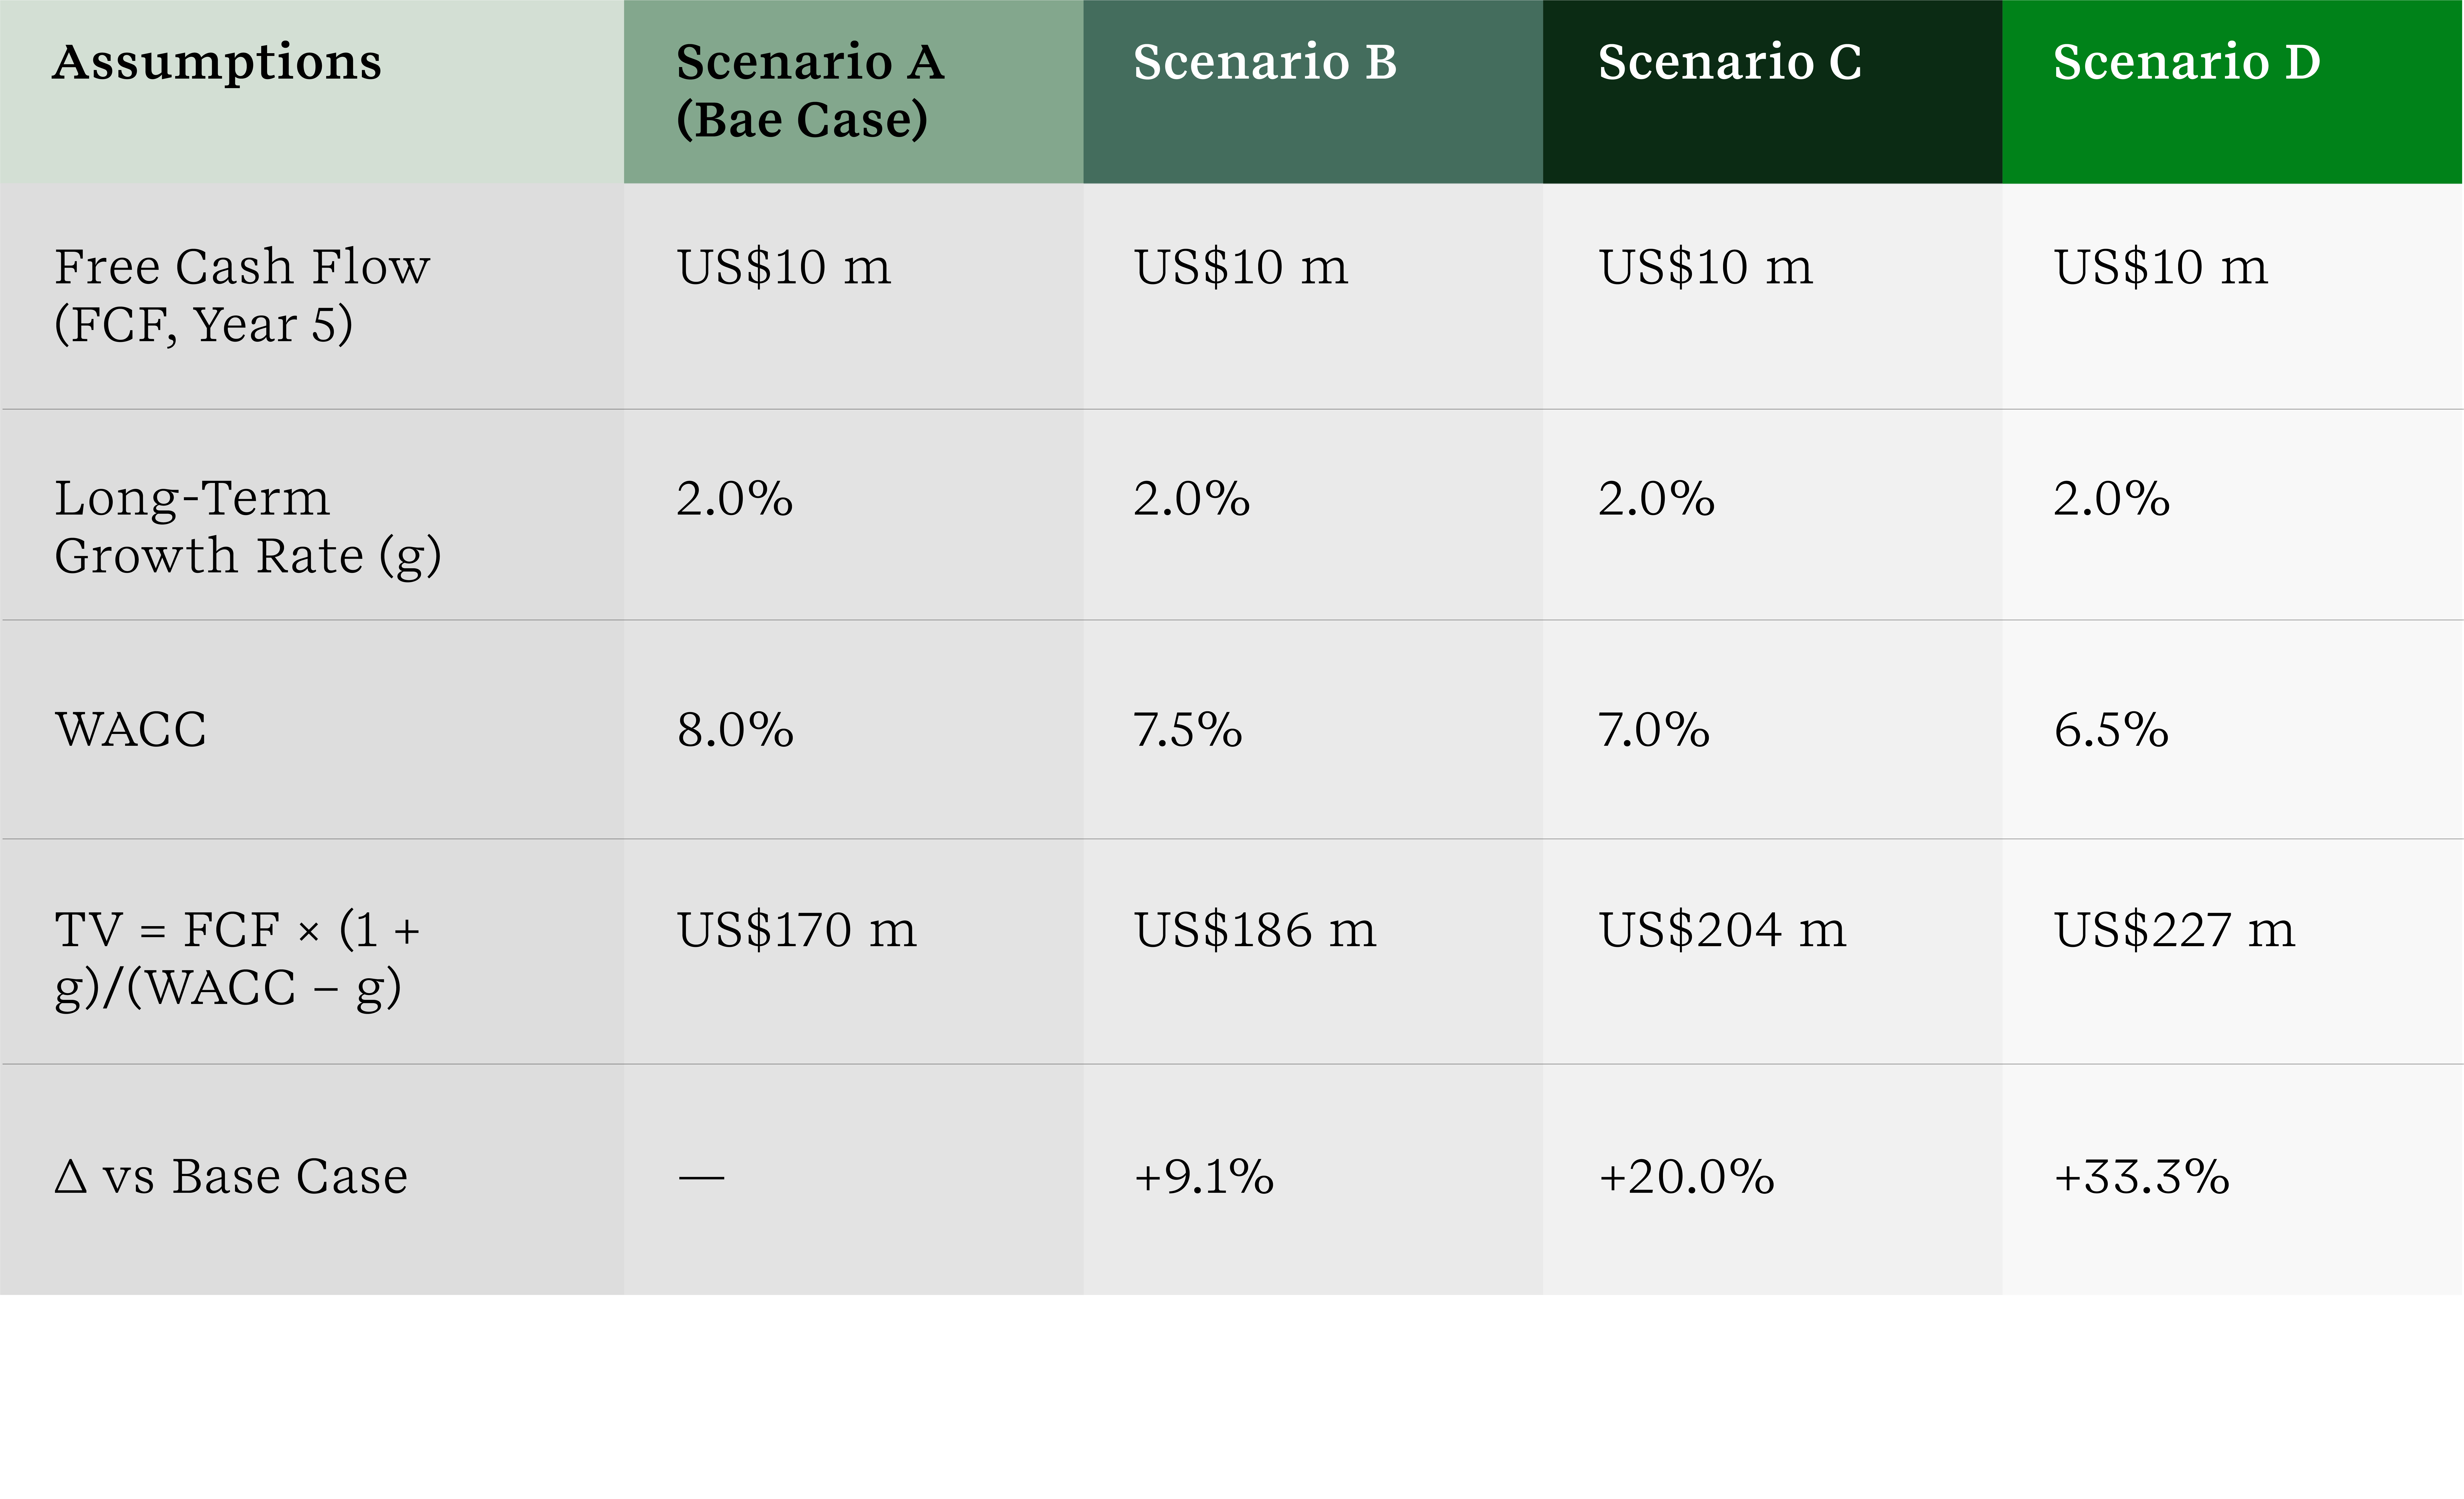
Empirical evidence suggests that the cost-of-debt advantage is modest. In recent years, corporate green bonds were priced around 1 to 6 basis points (bps) tighter than conventional debt, with outliers of 15 to 20 bps. On their own, these differences are unlikely to transform enterprise valuation. However, focusing solely on green bond spreads provides an incomplete picture. In practice, the most meaningful impact comes from changes in the cost of equity, reflecting investor perceptions of long-term risk, resilience, and growth: research suggests that high sustainability performance can lower the cost of equity by more than 200 bps, with results varying per sector.
This substantially changes the EV outlook for companies with long-lasting assets due to its effect on terminal value. For near-term projects, including energy-efficiency retrofits, on-site solar, or waste reduction, which typically deliver savings within a few years traditional tools such as net present value (NPV) and internal rate of return (IRR) are effective. However, TV is shaped by longer-term assumptions about reduced risks. When investors believe that a company’s sustainability strategy improves the durability of cash flows, lowers downside risk, or reduces volatility across cycles, they will adjust the discount rate accordingly.
This highlights the importance of placing the financing greenium within a broader scenario- and TV sensitivity-analysis context, rather than treating it as a financing advantage in the corporate green bond market. A structured approach to scenario and sensitivity analysis ensures that financing assumptions are grounded in realistic risk and growth expectations. Business leaders should test TV across a range of WACC assumptions. In parallel, they should ensure growth assumptions capture climate resilience and transition risks and opportunities in the context of their sector.
|
Finance case study - Shell Plc Shell’s 2024 Annual Report provides a strong example of how climate scenarios are embedded into valuation. The company stress-tested the carrying value of its fossil fuel assets under multiple climate and carbon price pathways. Applying the IEA Net Zero Emissions by 2050 (NZE50) scenario, Shell estimated that recoverable amounts would be $26–$34 billion lower across its Integrated Oil & Gas portfolios. This scenario integrates escalating carbon prices, from around $100 per metric ton in 2030 to as high as $230 per metric ton by mid-century. Shell also applies differentiated discount rates — 7.5% for oil and gas business activities, 6% for power and renewables — recalibrated annually against market yields and risk premiums. This approach illustrates how sensitivity and scenario analysis can turn climate uncertainty into financial insight. |
Management teams seeking to translate sustainability efforts into a lasting greenium need to carefully think through their approach.
Several crucial questions that will likely come up in the process of optimizing their revenue greenium are:
To fully capture the financing greenium, it is crucial to reach equity investors. Some important question companies will need to ask in this area are:
The greenium is real, but it takes strategy and focus to translate it into an enduring advantage. The revenue greenium for sustainability-related goods will only last if companies leverage initial price premiums to lower costs and win market share. To position sustainability as a driver of competitiveness, CFOs and CSOs must link it directly to discount rates, cash-flow resilience, and enterprise value.

Why CFO-grade metrics are essential to proving the business value of sustainability - and how companies can quantify ESG initiatives to drive returns.

The commercial upsides of climate-related action will only attract management attention and capital if they are robustly quantified.

A persistent disconnect between companies and investors limits capital flows into decarbonization projects. Effective climate transition planning can help close the divide.