Environment supporting data
Data presented here supports the Environment section of this report.
GHG emissions intensity FY16 - FY18 (tCO2e/FTE) ¹ ²
Notes:
1 Total GHG emissions normalized by average full-time equivalent (FTE) employees.
2 FY16 and FY17 GHG emissions intensity data reported in the FY17 Sustainability Report was overstated by 0.2 tCO2e/FTE. We have improved the estimation methodology for calculating this category and results have been restated applying this enhanced methodology. FY16 has reduced from 4.7 to 4.5 tCO2e/FTE and FY17 has reduced from 4.9 to 4.7 tCO2e/FTE.
Total GHG Emissions FY16 - FY18 ¹ ² ³
Notes:
1 Total GHG emissions include Scope 1, 2 and 3 emissions.
2 All data has been calculated using a market-based approach, unless otherwise stated. For further information on market-based methods, please refer to http://www.ghgprotocol.org.
3 FY16 and FY17 GHG emissions data reported in the FY17 Sustainability Report was overstated by 4%. We improved the estimation methodology for calculating this category and results have been restated applying this methodology. FY16 has reduced from 21,626 tCO2e to 20,727 tCO2e and FY17 has reduced from 20,946 to 20,109 tCO2e.
Total GHG emissions by region in FY18 (tCO2e)
| Total GHG emisions by Region | |||
|---|---|---|---|
| FY16 | FY17 | FY18 | |
| Europe, Middle East and Africa | 4,073 | 4103 | 3,550 |
| Asia Pacific | 3,948 | 3,602 | 3,357 |
| Latin America and Caribbean | 983 | 908 | 983 |
| North America | 10,117 | 10,160 | 9,460 |
| Global Businesses | 941 | 565 | 432 |
| Group | 664 | 771 | 996 |
| Total | 20,727 | 20,109 | 18,778 |
Scope 1 emissions FY16 - FY18 (tCO2e) ¹ ²
| Scope 1 | |||
|---|---|---|---|
| FY16 | FY17 | FY18 | |
| Europe, Middle East and Africa | 423 | 545 | 553 |
| Asia Pacific | 80 | 105 | 54 |
| Latin America and Caribbean | 56 | 40 | 35 |
| North America | 972 | 701 | 759 |
| Global Businesses | 1 | 1 | 0 |
| Group | 0 | 0 | 0 |
| Total | 1,532 | 1,392 | 1,400 |
Notes:
1 Scope 1 includes direct emissions from operations we own or control, including ERM owned vehicles and fuel consumption.
2 Scope 1 emissions from Global Businesses and Group are included in the data for the ERM region in which employees home offices are located.
Scope 2 emissions FY16 - FY18 (tCO2e) ¹ ² ³ ⁴
| Market Based | Location Based | |||||
|---|---|---|---|---|---|---|
| FY16 | FY17 | FY18 | FY16 | FY17 | FY18 | |
| Europe, Middle East and Africa | 609 | 519 | 509 | 575 | 509 | 517 |
| Asia Pacific | 879 | 751 | 670 | 926 | 783 | 670 |
| Latin America and Caribbean | 107 | 115 | 91 | 107 | 115 | 91 |
| North America | 2,349 | 2,509 | 2,070 | 2,382 | 2,513 | 2,070 |
| Global Businesses | 16 | 12 | 8 | 0 | 0 | 0 |
| Total | 3,960 | 3,906 | 3,348 | 3,390 | 3,920 | 3,348 |
Notes:
1 Scope 2 includes indirect emissions from the generation of purchased energy.
2 Scope 2 emissions from Global Businesses and Group are included in the data for the ERM region in which employees home offices are located. However as from FY16, due to an office opening, there are Scope 2 emissions for Global Businesses.
3 In our FY17 Sustainability Report emissions from electricity used in shared facilities were part of Scope 2 emissions. As from FY18 they fall under Scope 3 emissions, because of the limited level of operational control on this category.
4 All data has been calculated using a market-based approach, unless otherwise stated. For further information on Scope 2 location and market-based methods, please refer to http://www.ghgprotocol.org.
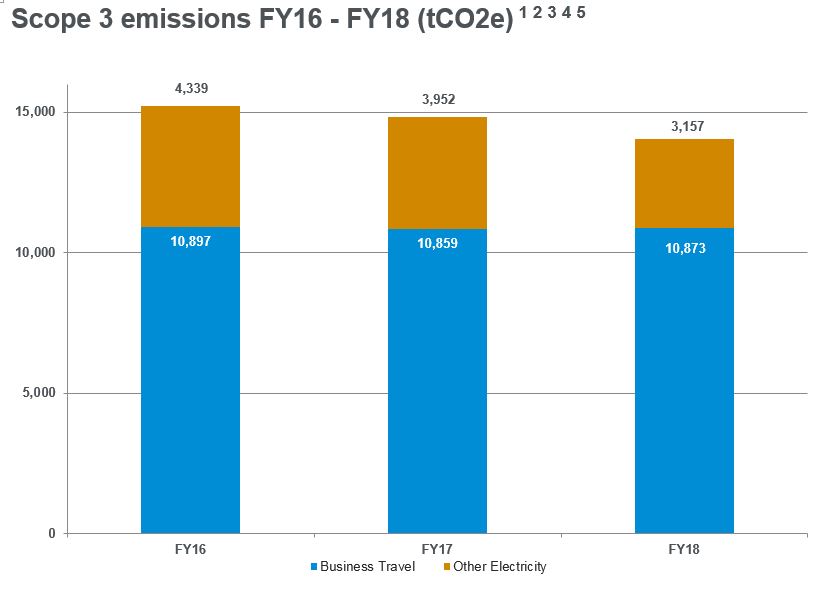
| Business Travel | Other Electricity | |||||
|---|---|---|---|---|---|---|
| FY16 | FY17 | FY18 | FY16 | FY17 | FY18 | |
| Europe, Middle East and Africa | 2,332 | 2,414 | 1,803 | 708 | 625 | 638 |
| Asia Pacific | 1,783 | 1,622 | 1,720 | 1,207 | 1,124 | 913 |
| Latin America and Caribbean | 686 | 616 | 753 | 134 | 137 | 104 |
| North America | 4,525 | 4,884 | 5,130 | 2,273 | 2,066 | 1,502 |
| Global Businesses | 907 | 552 | 471 | 17 | 0 | 0 |
| Group | 663 | 771 | 996 | 0 | 0 | 0 |
| Total | 10,897 | 10,859 | 10,873 | 4,339 | 3,952 | 3,157 |
Notes:
1 Scope 3 includes indirect emissions (business travel and electricity used in shared spaces).
2 As from FY18 emissions from Other Electricity (electricity used in shared building spaces) have been categorized as part of Scope 3 emissions due to the limited level of operational control on this category.
3 Other Electricity includes the portion of shared electricity for which ERM is responsible in multiple-occupant buildings, where this amount is not already reported or included in office billings.
4 Other Electricity emissions from Global businesses and Group are included in the data for the ERM region in which employees home offices are located. Due to an office opening in FY16, there are emissions from Global businesses.
5 Other Electricity results reported in the FY17 Sustainability Report have been restated by 16% (910 tCO2e) in FY16 and by 16% (763 tCO2e) for the FY17 Total Other Electricity. We improved the estimation methodology for calculating this category and results have been restated applying this methodology.
Global office energy use FY16-FY18 (MWh) ¹ ² ³
| Scope 2 | Scope 1 and 2 | Scope 3 | ||||||||||||
|---|---|---|---|---|---|---|---|---|---|---|---|---|---|---|
| Office Electricity | RECs Electricity | Fuel Consumption | Other Electricity | |||||||||||
| FY16 | FY17 | FY18 | FY16 | FY17 | FY18 | FY16 | FY17 | FY18 | FY16 | FY17 | FY18 | |||
| Europe, Middle East and Africa | 1,179 | 1,014 | 1,138 | 90 | 206 | 139 | 583 | 1,095 | 1,070 | 1,187 | 996 | 1,144 | ||
| Asia Pacific | 1,224 | 1,120 | 1,018 | 57 | 42 | 0 | 32 | 26 | 37 | 1,635 | 1,654 | 1,347 | ||
| Latin America and Caribbean | 421 | 395 | 344 | 0 | 0 | 0 | 0 | 0 | 0 | 518 | 416 | 338 | ||
| North America | 5,048 | 5,434 | 4,977 | 113 | 8 | 0 | 2,128 | 1,638 | 1,927 | 5,174 | 4,559 | 3,678 | ||
| Global Businesses | 33 | 24 | 18 | 0 | 0 | 0 | 0 | 0 | 0 | 36 | 0 | 0 | ||
| Total (MWh) | 7,905 | 7,987 | 7,495 | 260 | 256 | 139 | 2,742 | 2,759 | 3,034 | 8,550 | 7,625 | 6,508 | ||
Notes:
1 REC — Renewable Energy Certificate, i.e., the tradable part of generated electricity from renewable resources representing attributes such as GHG emissions.
2 The portion of shared resources for which ERM is responsible in multiple-occupant buildings, where this amount is not already included in office billings.
3 Other electricity results reported in the FY17 Sustainability Report have been restated by 16% (1,627 MWh) for FY16 and by 16% (1,616 MWh) for FY17. We improved the estimation methodology for calculating this category and results have been restated applying this methodology.
Business travel FY16-FY18 (tCO2e) ¹ ²
| FY16 | FY17 | FY18 | |
|---|---|---|---|
| Europe, Middle East and Africa | 2,572 | 2,670 | 2,093 |
| Asia Pacific | 1,795 | 1,632 | 1,725 |
| Latin America and Caribbean | 719 | 635 | 769 |
| North America | 4,951 | 5,229 | 5,452 |
| Speciality Global Business | 907 | 552 | 471 |
| Group | 663 | 771 | 996 |
| Total | 11,608 | 11,489 | 11,506 |
Notes:
1 Business travel emissions total includes all Scope 3 emissions ( 10,873 tCO2e) plus Scope 1 emissions associated with fuel consumption for leased vehicles (633 tCO2e).
2 Data is expressed as tCO2e and includes all Kyoto gases and refrigerants.
Business travel by mode in FY18 (tCO2e)¹
| FY16 | FY17 | FY18 | |
|---|---|---|---|
| Air | 8,201 | 7,970 | 8,315 |
| Road | 3,266 | 3,347 | 3,027 |
| Rail | 141 | 172 | 164 |
| Total | 11,608 | 11,489 | 11,506 |
Notes:
1 Road travel includes both Scope 1 and 3 car travel.