Our people supporting data
Data presented here support the Our people section of this report.
Employee head count by employment contract, by gender FY18
| Permanent | Temporary | ||||
|---|---|---|---|---|---|
| Full time | Part time | Full time | Part time | Total | |
| Female | 1,764 | 297 | 98 | 171 | 2,330 |
| Male | 2,196 | 108 | 141 | 140 | 2,585 |
| Total | 3,930 | 405 | 239 | 311 | 4,915 |
Employee head count, by region FY18
| Permanent | Temporary | Total | |
|---|---|---|---|
| North America | 1,767 | 284 | 2,051 |
| Asia Pacific | 794 | 109 | 903 |
| Europe, Middle East and Africa | 1,060 | 111 | 1,171 |
| Latin America and Caribbean | 442 | 29 | 471 |
| Global Businesses | 144 | 13 | 157 |
| Group | 158 | 4 | 162 |
| Total | 4,365 | 550 | 4,915 |
Employee head count by employment contract, by gender FY18 1 2
Employee category by age group FY18 (%)
| Under 30 | 30 -50 | Over 50 | |
|---|---|---|---|
| Board of Directors | 0% | 55.6% | 44.4% |
| Executive Committee | 0% | 26.7% | 73.3% |
| Partners | 0.2% | 48.3% | 51.5% |
| Senior Consultant 1 | 0.4% | 61.8% | 37.9% |
| Consultant 2 | 30.6% | 60.9% | 8.5% |
| Professional Support | 15.1% | 63.9% | 20.9% |
| All employees | 19.6% | 60.2% | 20.3% |
Notes:
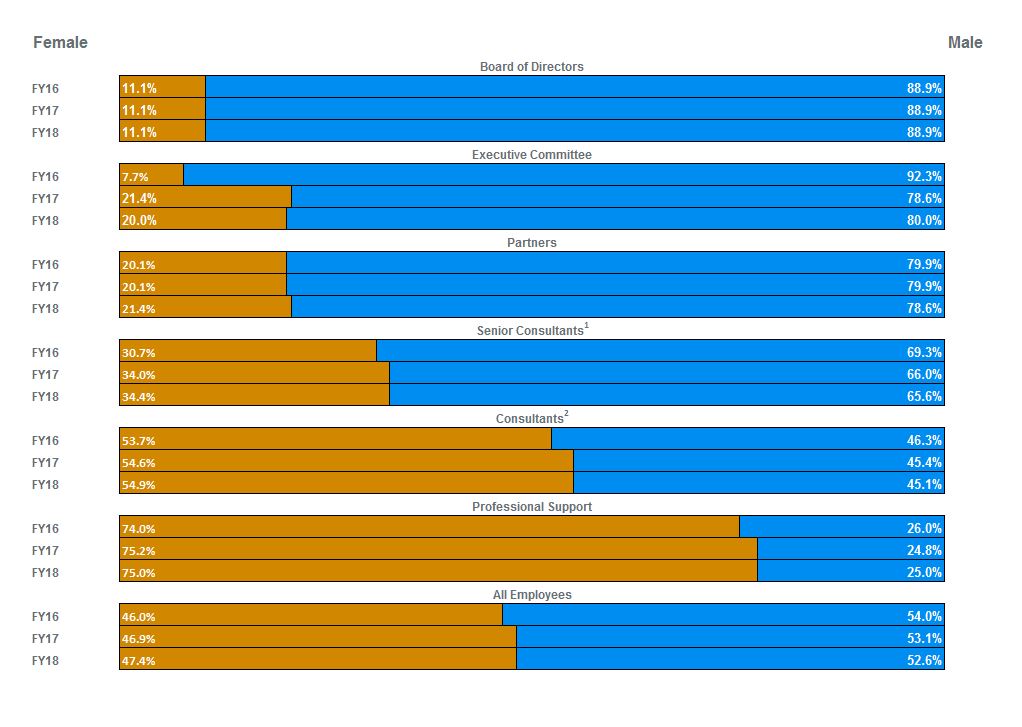
1 Senior Consultants includes all consultants at ERM career levels 4 and 5.
2 Consultants includes all consultants at ERM career levels 1 to 3.